Read Time: 4 minutes
When it comes to using as enterprise performance management solution (EPM), metrics and key performance indicators (KPIs) are essential components. These KPIs help executives understand how their business is performing against its goals to help advance decision-making. In order to ensure complete comprehension of how the business is currently operating, executives must be utilizing a combination of both lagging and leading KPIs.
Metrics, KPIs, and Scorecards
What is a KPI?
The concept of KPI metrics is integral to an enterprise performance solution (EPM) in that it helps management concentrate on how their organization is performing against pre-defined, critical goals and objectives. These KPIs are usually communicated to executives and managers through reports, dashboards, or scorecards that are delivered electronically. The management metrics that are being focused on vary between departments and industries. So, while Human Resources may be tracking employee turnover, Sales may be following pipeline and coverage ratio. Finance KPIs may include:
- Days sales outstanding (DSO)
- Return on equity (ROE)
- Working capital
- Debt to equity ratio
- Inventory turnover
- Gross profit margin
- Net profit margin
What is the best way to define your KPIs?
Due to the current business climate and extensive usage of “big data”, both finance and operating managers are realizing the importance of becoming more metrics-oriented when managing their slice of the business. So, how do they know they are tracking the right KPIs and metrics? And what is the best way for you to define your business’s KPIs?
While there are several methodologies that are used to define KPIs, one of the most popular and effective is The Balanced Scorecard methodology. First defined in 1992 by Robert Kaplan and David Norton, The Balanced Scorecard methodology hones in on the development of metrics or KPIs across four essential perspectives: financial, customer, business process, and learning & growth. Since its conception, The Balanced Scorecard methodology has evolved to include the concept of a strategy map which helps identify cause-and-effect links between strategic goals and KPIs. Whether your company decides to use The Balanced Scorecard methodology or one of the other methodologies that define KPIs, make sure it has these features:
- Utilizes a mix of financial and non-financial KPIs
- Uses a combination of leading and lagging indicators
- Produces timely results (i.e., daily, weekly, monthly, quarterly)
- Able to be actionable by management
- Operates with significance, tied to specific goals and objectives
What is the difference between Lagging vs. Leading KPIs?
When choosing a methodology it is crucial that your business adopts one that uses a combination of leading and lagging indicators. Lagging KPIs focus on past results, whereas leading indicators focus on the future. Lagging indicators are typically “output” oriented, easy to measure but hard to improve or influence period Leading indicators, on the other hand, are typically input-oriented, hard to measure and easy to influence. Most financial indicators such as revenue, profit, and costs are lagging indicators and are the results of the activities of the company. On the other hand, leading indicators are often related to activities undertaken by employees. For example:
- Sales orders or leads – a leading indicator for revenue
- Customer satisfaction – a leading indicator for propensity to buy or renew
- Employee engagement – a leading indicator for employee turnover
- Supplier lead time – a leading indicator for delivering on future orders
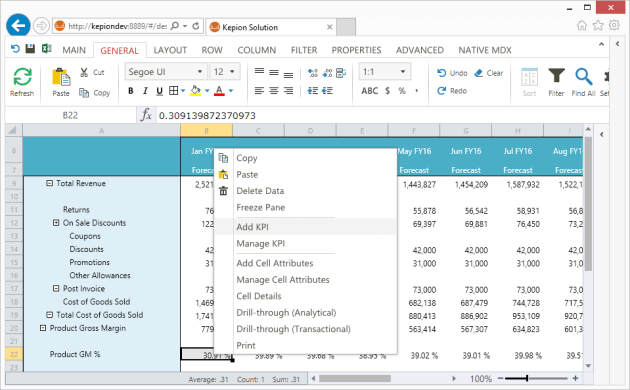
How to track KPIs with Kepion
With a concrete understanding of your firm’s KPIs, you can focus on the crucial decisions that will positively affect the outcome of your business. This will enable you to better utilize your enterprise performance management software (EPM) more effectively and efficiently.
You may find it difficult to track your organization’s performance over time, or accurately forecast key performance indicators for your organization. With Kepion business intelligence software, you can monitor and analyze historical trends to set new targets for your KPIs.
Since Kepion is built on the Microsoft Business Intelligence platform, you can tie together the targets set within Kepion with visual scorecards and KPIs for users to monitor their performance. Kepion provides a data modeling tool for building OLAP data environments for your organization and make it easy to configure KPIs to use within your forms. This allows you to quickly spot the areas of risk and opportunities for your organization. With Kepion’s click-thru filter navigation, you can drill down to your slice of information. This way, you’ll be able to track your company’s performance across different business areas in real-time.
Get a Kepion demo today improve your KPI tracking.